Key Takeaway
Zone 2 boundaries vary widely between individuals; standardized markers like fixed HR percentages may poorly reflect actual metabolic responses, making personalized prescriptions based on VT1 or FatMax more accurate.
Summary
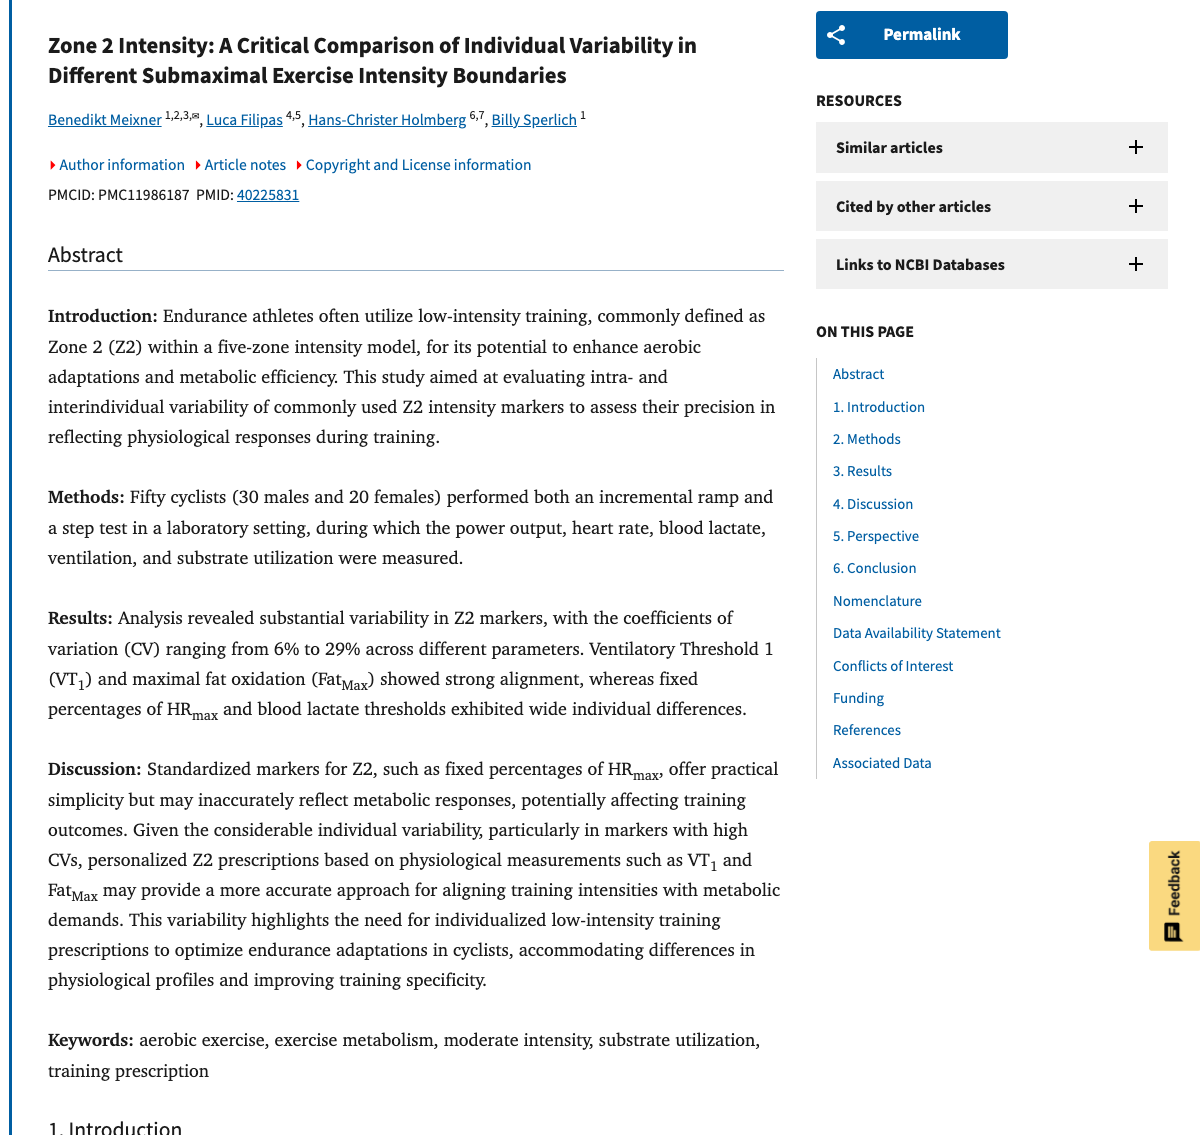
This study investigated the individual variability in commonly used Zone 2 intensity markers to assess how precisely they reflect physiological responses during training. Fifty cyclists (30 males, 20 females) performed both incremental ramp and step tests while researchers measured power output, heart rate, blood lactate, ventilation, and substrate utilization.
The analysis revealed substantial variability in Zone 2 markers, with coefficients of variation (CV) ranging from 6% to 29% across different parameters. Ventilatory Threshold 1 (VT1) and maximal fat oxidation (FatMax) showed strong alignment with each other, while fixed percentages of HRmax and blood lactate thresholds exhibited wide individual differences.
The findings suggest that standardized markers for Zone 2, such as fixed percentages of HRmax (the common "60-70% of max HR" prescription), offer practical simplicity but may inaccurately reflect actual metabolic responses. This could affect training outcomes when athletes are training at prescribed percentages that don't match their individual physiology. The researchers recommend personalized Zone 2 prescriptions based on physiological measurements like VT1 and FatMax to better align training intensities with metabolic demands.
Methods
Fifty cyclists (30 males, 20 females) completed both an incremental ramp test and a step test in laboratory conditions. Measurements included power output, heart rate, blood lactate concentration, ventilation parameters, and substrate utilization (fat vs carbohydrate oxidation). Zone 2 boundaries were determined using multiple methods: fixed percentages of HRmax, lactate thresholds, ventilatory threshold 1 (VT1), and maximal fat oxidation point (FatMax). Variability was assessed using coefficients of variation (CV).
Key Results
- Coefficients of variation ranged from 6% to 29% across Zone 2 markers
- VT1 and FatMax demonstrated strong alignment with each other
- Fixed percentages of HRmax showed wide individual differences
- Blood lactate threshold markers also exhibited high interindividual variability
- The discrepancy between standardized HR-based prescriptions and actual metabolic thresholds was significant in many participants
Figures
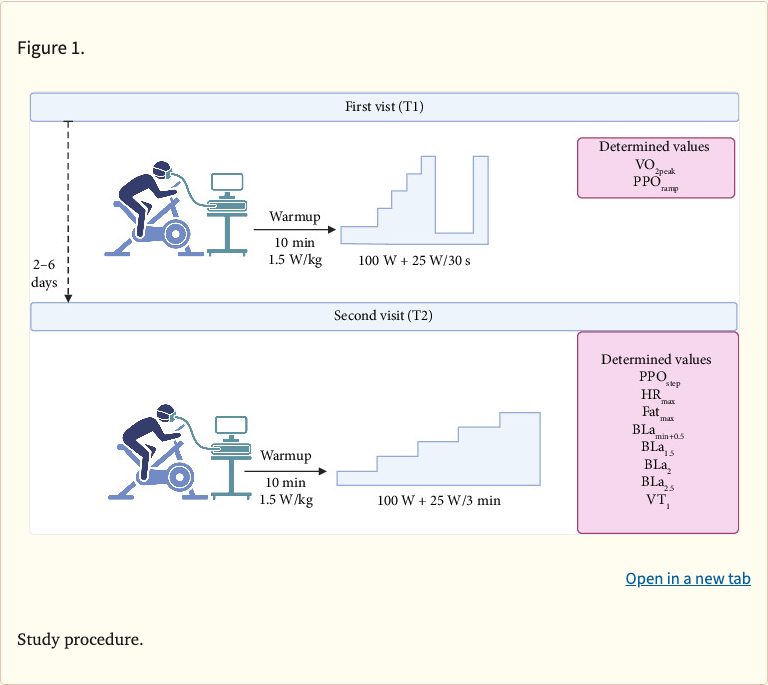 Figure 1
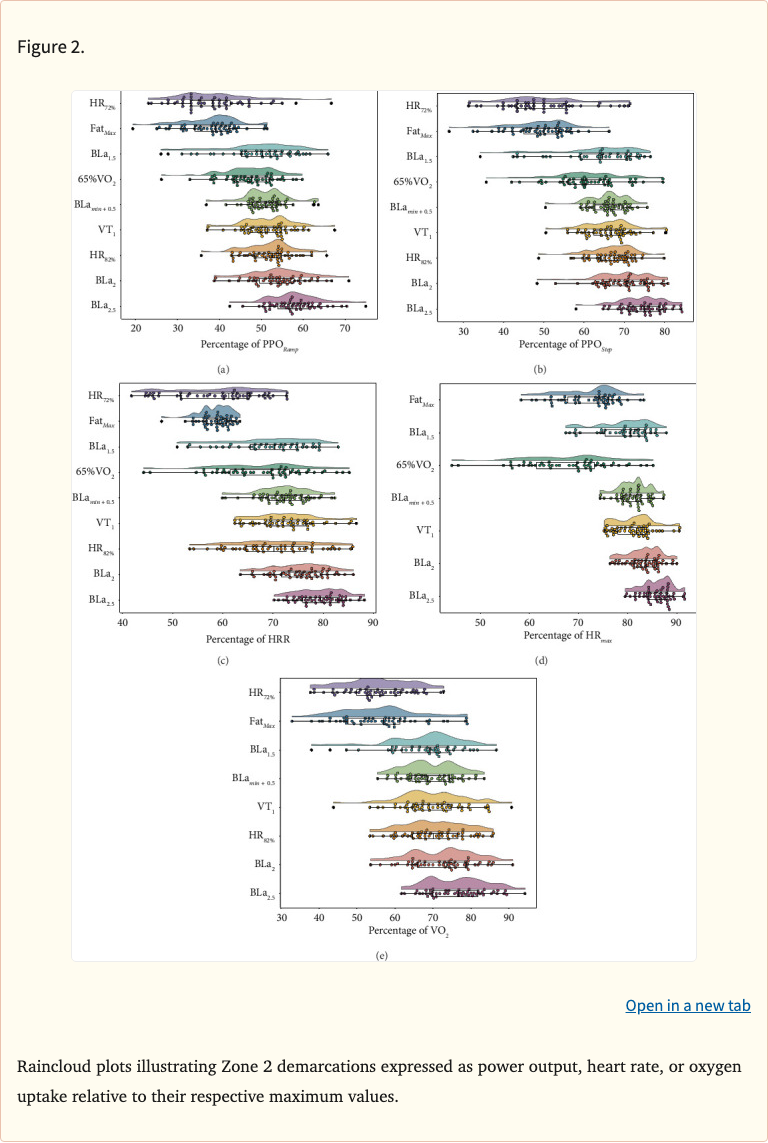 Figure 2
 Figure 3
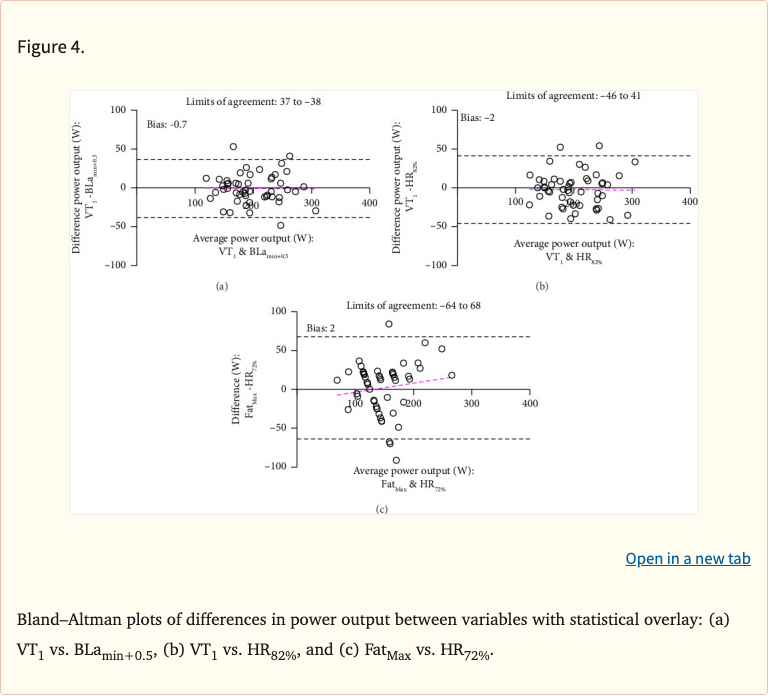 Figure 4
Limitations
- Limited to cyclists; results may differ in other endurance sports
- Laboratory testing conditions may not perfectly replicate real-world training scenarios
- Cross-sectional design; did not track how variability affects long-term training adaptations
- FatMax determination can be affected by pre-test nutrition and glycogen status